JupyterLab
The Fornax Science Console offers a lightly customized version of JupyterLab that many Python users will find familiar. We refer readers to the JupyterLab documentation for details of the interface. Here we define the major components of this interface that we will refer to throughout the User Guide.
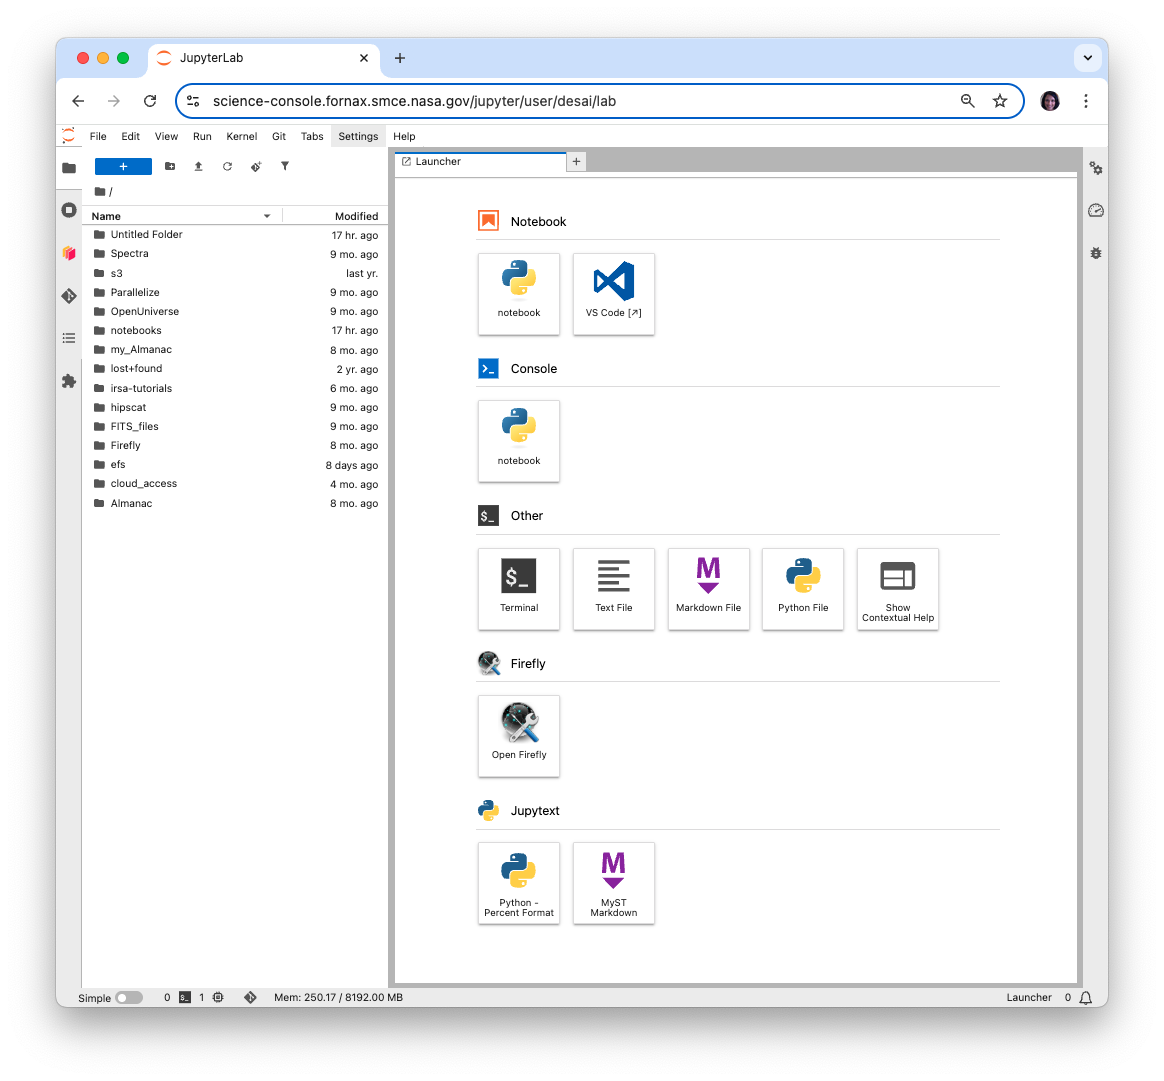
JupyterLab deployed in the Fornax Science Console
Main Work Area
The main work area in JupyterLab is the central space where you open and interact with documents, notebooks, terminals, consoles, and other panels. It supports multi-document, tabbed, and split-pane layouts, allowing you to work with multiple files side by side.
You can drag and arrange tabs freely, view code, outputs, data files, or terminals in one unified interface, and seamlessly switch between tasks—making it a flexible environment for data analysis, coding, and exploration.
Menu Bar (Topmost horizontal menu)
This contains dropdown menus like File, Edit, View, Run, Kernel, Git, Tabs, Settings, Help
Left Sidebar
The left sidebar is a vertical strip of icons, each representing a tool or extension that will open up in the left column of the interface.
- File Browser (📁)
Lets you navigate and open files and folders. Double-click a file or .ipynb notebook to open it in the main area. Opening .md files as notebooks should be done by right clicking on the file -> “Open With” -> “Notebook” so that they display in the expected format with cells of runable code.
This includes the Launcher(blue plus sign), New Folder (folder symbol with plus sign), and Upload Files (up arrow) icons.
The Launcher will open a panel in the main area that provides clickable tiles for quickly starting new tools, such as notebooks and terminals. Below we discuss some of the tools available via the Launcher.
Visual Studio Code (VS Code) is an integrated development environment(IDE) widely used for programming in many languages—including Python, JavaScript, C++, and more.
Firefly is a visualization platform designed to facilitate interactive exploration of astronomical data, including images, catalogs, and plots, through a modern, browser-based interface.
Terminal provides a command line, which allows users to run Emacs or vi .
- Dask
Dask is a Python library for parallel computing. The Fornax Science Console includes the Dask JupyterLab Extension which can be used to manage a Dask cluster and monitor the progress of submitted functions. The charts that make up Dask’s monitoring dashboard are embedded directly in JupyterLab panes which can be moved around into custom arrangements.
After clicking on Dask in the left sidebar, scroll down in the left column and click “+NEW” next to “CLUSTERS” to start a new cluster. Once the cluster starts, you’ll see a column of yellow buttons appear with the names of available charts. Click on any of them and a new tab will open showing the selected chart. You can drag and drop the tab to move it somewhere else on the screen.
Start or restart the kernel for the notebook you’re working in so that it will recognize the cluster.
- Git
This extension integrates Git version control into the JupyterLab interface, enabling you to stage, commit, push, and pull notebook and code changes without leaving the environment. It provides visual diffs, branch management, and history browsing, making collaborative development and reproducibility seamless.
- Table of Contents Automatically generates a sidebar outline of all headings in your notebook or document, allowing you to quickly navigate between sections.
- Extensions Manager
Shows installed extensions and lets you manage them.
Right toolbar
The right toolbar is a vertical strip of icons, each representing a tool or panel that will open up in the right column of the interface.
- Property Inspector
Shows metadata, configuration options, or properties for the currently selected item in the JupyterLab interface.
- Kernel Usage
In JupyterLab, a kernel is the computational engine that executes your code. When you open a notebook or console in JupyterLab, it connects to a kernel that runs the code you write, keeps track of variables, and returns output (such as plots, results, or errors) back to the interface.
The Kernel Usage tool monitors resources (such as CPU and memory) being used by your Jupyter kernel.
- Running Terminals and Kernels
Monitors and manages active processes in your JupyterLab environment, such as running notebooks, terminals, and associated kernels.
- Debugger
Allows you to step through your code to identify bugs, understand the flow of execution, and troubleshoot issues in real-time by providing features like breakpoints, variable inspection, and call stacks.
Jupyterlab Session Information
To allow for efficient use of resources, idle sessions will be stopped (or culled). Fornax has the following guidelines for session culling:
- All sessions have a hard upper limit of 48 hours.
- If session contains running jobs with CPU activity up to the hard limit, it will not be culled.
- A session is stopped after 15 minutes of no activity.
- The user can override the 15 min limit by using the Keep-Alive feature under the Foranx menu.
- Start a session: You can request the session to stay alive by selecting:
Fornax -> Keep-alive -> Start Keep-alive Session. Pick a time using the abbreviated notation such as ‘2d’ for two days, ‘3h45m’ for 3 hours and 45 minutes, or the time in seconds as an integer. - Stop a session: end a previously started session by
Fornax -> Keep-alive -> Start Keep-alive Session. - The time remaining in the currently requested session is shown in the status bar at the bottom left, e.g. ‘Keepalive: 35m’.
- Start a session: You can request the session to stay alive by selecting: